Tackling AI Hallucinations in LLM Apps
How Token Log-Probabilities Can Predict LLM Reliability

Content:
1. Review of relevant Machine Learning (ML) concepts (precision/recall, LLM intuition)
2. Using sequence log-probability metric as LLM confidence
3. Results from a case study in filtering poor quality LLM outputs
Introduction
To LLM or not to LLM?
Large Language Models (LLMs) like ChatGPT, Claude, LLaMA are incredibly powerful but are still an emerging technology that can pose unique risks. Sometimes LLMs seem to know exactly what is going on and can easily answer complex questions. Yet, other times, they output irrelevant information or even “hallucinate” (make up information).
![ChatGPT hallucinated legal cases that went on to be cited by a law firm. [The Guardian]](https://miro.medium.com/v2/resize:fit:700/1*A9h3OY2JJvfPU8mAh4WWPg.png)
Why LLM?
Many companies are exploring ways to use LLMs and Machine Learning to improve customer experience. One common use case is handling customer support questions. For example, a company might receive thousands of support questions daily, some of which are answered with appropriate internal documentation (e.g. “How do I add a contractor?”, “How to change an employee status to part-time?”). In such scenarios, an LLM-based question-answering service could help customers quickly find relevant information using natural language queries.
In such applications, it is crucial to maintain high confidence that the LLM understands requests and can answer them accurately. Let’s examine one potential approach to this using LLM confidence.
ML Review
Precision-Recall Curve
In traditional Machine Learning (ML) modeling approaches, we often have ways to prevent poor quality outputs by controlling the model’s confidence.
- Typically, ML models’ low-confidence outputs would contain more errors.
- We aim to balance the tradeoff: maximize the number of available “good predictions” shown to users (high recall), and minimize the number of “bad predictions” shown to users (high precision).
- We select a confidence threshold that balances our needs.
ROC curve and Precision-Recall curves (PR curve) are common ways to look at this trade-off.
However, LLM output is free-form text, not a nice class label and confidence like in traditional Machine Learning systems. So these techniques seemingly don’t apply to ML systems that rely on LLMs. But before we give up (spoiler: we can get pretty close to what we need), let’s review what LLMs actually do.
Review: GPT Intuition
Generative Pretrained Transformer (GPT) is a common architecture of LLMs.
- GPT model works with a limited vocabulary of words (tokens) — T
- At every token position in the generated sequence, GPT computes a likelihood probability distribution over vocabulary T — P(T_i | context). You can think of it as an n-gram model, where token probability is estimated using a large (1.76 trillion parameter for GPT-4) neural network.
- GPT “knowledge” is effectively stored as contextual probabilities of each token, given the current context (see Figure 1).
Is there anything we can learn from these token log-probabilities?
Finding Confidence in LLMs
LLM Confidence Score
We find guidance for detecting hallucinations by looking at machine translation literature where transformer-type ML models were commonly used.
- “We hypothesize that when hallucinating, the model is not confident.” [1] this can be captured in token log-probabilities.
- Seq-Logprob (i.e. “LLM confidence”) — an average of log-probabilities from sequence generation. If GPT generated a sequence “the boy went to the playground”, with these top-token logprobs ([-0.25, -0.1, -0.15, -0.3, -0.2, -0.05]), we compute GPT confidence as:
llm_confidence = np.mean([-0.25, -0.1, -0.15, -0.3, -0.2, -0.05]) # -0.175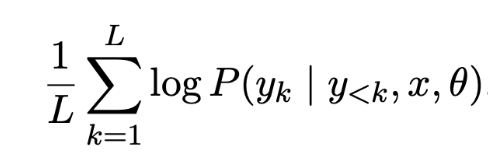
Why it’s good:
- It’s good quality. “Seq-Logprob is the best heuristic and performs on par with reference-based COMET. The less confident the model is, the more likely it is to generate an inadequate translation” [1]
- It’s free. “Seq-Logprob scores are easily obtained as a by-product of generating” a response with LLM. [1]
LLM Design Pattern
When implementing an LLM service, we could:
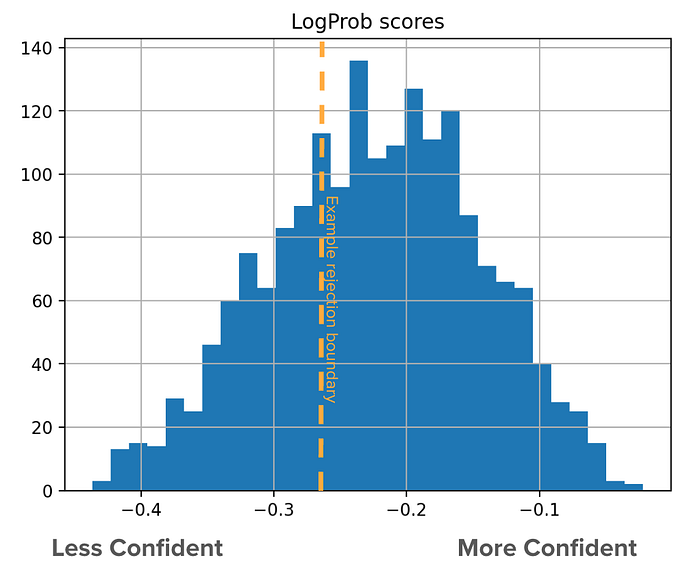
- Collect Seq-LogProb (confidence) scores for outputs to understand expected output confidence distribution. Logprob scores are available through OpenAI API. [3]
- Monitor LLM outputs at the bottom end of the confidence distribution.
- Using this decision boundary* you can automatically:
a) Reject poor-quality responses
b) Introduce expert-in-the-loop verification for low-confidence responses
c) Try to collect more information to make the LLM more confident
*LLM confidence distribution is sensitive to prompt changes. So calibrate the boundary accordingly.
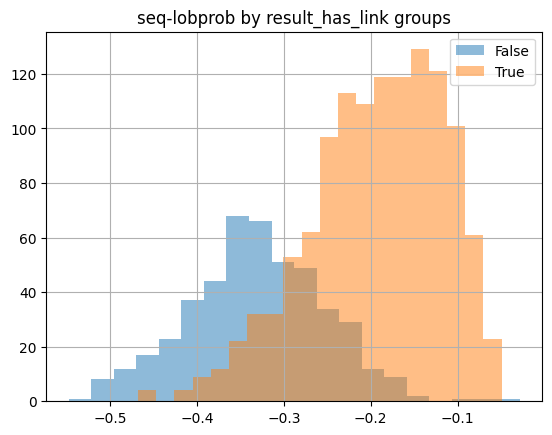
In my testing process, I found that not-confident responses are often vague or overly broad (see Figure 3 left), more likely to make stuff up, and less likely to follow prompt guidelines, such as including sources (see Figure 3, right) or not engaging in a conversation. Confident responses are usually precise in their instructions, understanding the problem and solution exactly. Using this knowledge, one could filter not-confident responses from ever being surfaced to customers.

Example Case Study: FAQ Service
Using LLM Confidence to Filter LLM Mistakes
To explore this approach in practice, I conducted a small experiment. I ran a sample of 1000 support questions through our question answering LLM service, recording LLM confidence scores.
I then asked our customer support experts to label LLM-generated outputs as “good quality” or “bad quality”. This gives me a binary label that I can align with LLM confidence scores for generated outputs.
This case study showed a 69% relative difference between the most confident and the least confident LLM responses. (see Figure 4)
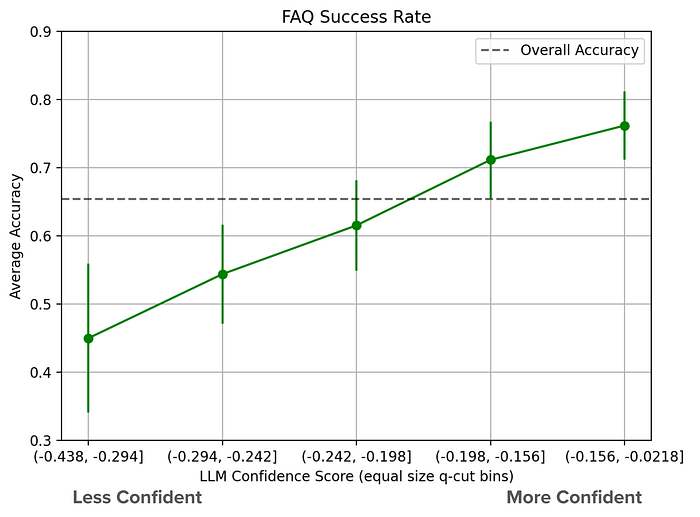
With a way to control LLM system sensitivity, we’re now closer to traditional ML systems, allowing us to control for a desired success rate.
LLM Precision-Recall Curve
Using our binary success label and LLM confidence as sensitivity, we can even visualize an actual PR curve for our LLM system!

We can think of this as “behind the scenes”. Even if we don’t always see it, this is happening in LLM “reasoning” for most generations.
This would allow us to effectively limit poor-quality responses from surfacing to customers.
Conclusion: More Reliable LLM Systems
- LLM confidence score is extremely effective at capturing hallucinations and separating poor vs good quality LLM outputs.
- We can implement better user experience patterns (e.g. expert verification) in LLM systems in an automated way.
References
[2] More recently on this topic: Detecting hallucinations in large language models using semantic entropy
[3] https://cookbook.openai.com/examples/using_logprobs
[4] To Believe or Not to Believe Your LLM — a related idea of using mutual information between multiple generations as LLM confidence